Weak Generational Hypothesis
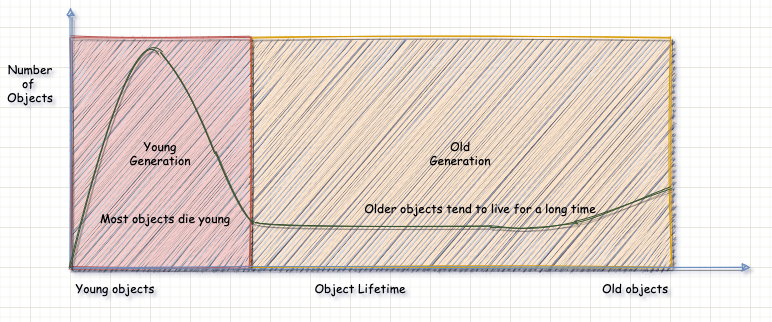
The weak generational hypothesis has had a profound impact on the JVM’s heaps layout. Understanding the weak generational hypothesis is essential in order to understand various GC algorithms and approaches. The Weak Generational Hypothesis states that most objects die young. In other words, most objects created will be garbage collected very quickly. Barry Hayes, in his seminal paper “Using Key Object Opportunism to Collect Old Objects”, pointed out that “newly created objects have a much lower survival rate than older objects” [^1]. This hypothesis was derived from observing object allocations/deallocations on a large number of live systems. The hypothesis also states that objects that tend to live past a certain age continue to live for a long time.
 |
|---|
| Weak Generational Hypothesis |
The diagram above illustrates the weak generational hypothesis. One can observe that there are a large number of objects that die young. Objects that do survive tend to live for a very long time.
Garbage collectors (not all) have taken advantage of this hypothesis by structuring the heap according to object generations. The heap is structured so that short-lived objects can be easily and quickly collected. Long-lived objects are separated from short-lived objects and are garbage collected using a different algorithm. GC’s that take advantage of the weak generational hypothesis are known as generational garbage collectors.
JVM Garbage Collector Basics
JVM GC algorithms employ a tracing garbage collector, which makes use of the weak generational hypothesis. Since most objects die young, the JVM subdivides the heap into separate regions according to object age. The subdivision of the heap enables the JVM to employ efficient GC algorithms according to object age. At a high level, the JVM splits the heap into two areas. The two areas are the young generation, aka nursery and the old generation, aka tenured. When analysing generational garbage collectors, it is imperative to delve into:
- Young generation algorithm – GC algorithm used to collect garbage in the young generation. Young generation collectors are generally copying collectors as these are very efficient on heap areas with a large number of dead objects, i.e. a sparse section of the heap.
- Old generation algorithm– GC algorithm used to collect garbage in the old generation. These are generally compacting collectors. Objects in the area of the heap live much longer and thus fragment memory. Compacting collectors defragment memory and thus help make the best use of available memory.
Let’s dig deeper into the heap’s memory allocations spaces:
Young Generation
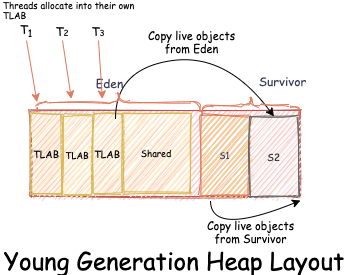
All newly created objects are allocated space in the young generation. The JVM further subdivides the young generation into sub-space, i.e. Eden, survivor one (S1), and survivor two (S2). To be precise, all newly created objects are allocated space in Eden. At startup, both of the survivor spaces are empty. At any given point in time, one of the survivor spaces (S1, S2) is always empty. During a minor GC, live objects are relocated from Eden and the “populated survivor space” into the “empty survivor space”. The GC maintains a counter called “age” for every object. An object’s age is incremented every time the object is moved from one heap area to another. Each object in the Java heap has a header. This header tracks the object age, i.e. the number of GC cycles an object has survived. The object age is tracked by utilising a few of the bits of this header. Objects are copied between survivor spaces a certain number of times before being eventually promoted to the Old Generation space. The process of promoting an object to the old generation is called aging. The actual threshold/age can is tuneable via the -XX:+MaxTenuringThreshold. By default, this value is 15 GC cycles.
 |
|---|
| Young Generation Heap Layout |
The garbage collection of the young generation is called a minor garbage collection or Minor GC. A Minor GC is triggered when the JVM is unable to allocate new objects. Typically minor GC’s employ a Mark and Copy GC algorithm as opposed to a Mark, Sweep, and Compact algorithm. After a minor GC, the entire Eden space is empty. All live objects from the Eden space are moved to a survivor space. This also holds true for the populated survivor space. All objects from one of the survivor spaces are cleared and copied into the other space, which was previously empty. During a Minor GC, the Old Generation is not collect. Minor GC’s necessitate stop-the-world pauses.
Memory allocation poses concurrency problems as multiple application threads can compete for the same memory area. Locking memory segments/areas during allocation is a simple solution. Locking, although simple, has the potential to severely slow down memory allocation. Eden is essentially a shared mutable state that multiple application threads are competing for. Efficiently managing Eden is a must to ensure quick memory allocation. Thread Local Allocation Buffer (TLAB) to the rescue. Eden is split into sub-areas called (TLAB). Every thread is assigned a TLAB. Each thread allocates memory into its own TLAB. Since each thread only allocates into its own TLAB, memory allocation takes place without an expensive synchronisation penalty. Allocating into a TLAB is as simple as allocating memory and bumping a pointer. If allocation inside a particular TLAB fails, the allocation is attempted in the shared Eden space. Allocation in the shared space is slower as this allocation needs to be synchronised. If the shared Eden space does not have enough space, then a minor GC is triggered, i.e. GC on the Young Generation. If the GC fails to free sufficient free memory inside Eden, the object is allocated in the Old Generation.
Old Generation
Tenured or long-lived objects are moved from the young generation into the old generation. Objects are garbage collected from the old generation during a major garbage collection event. For a number of GC algorithms, a major GC is a stop the world event which does mark, sweep, and compact. The term full GC and major GC are a source of confusion. Although there are is no formal definition, a full GC refers to cleaning the entire heap while a major GC just refers to cleaning tenured. A full GC is both a minor and major garbage collection. The JVM reports every Major Collection as Full GC.[^6]. This is because a major GC is triggered as a result of a minor GC. When the heap is full, a minor GC is triggered. If the minor GC cannot find enough space in tenured, it triggers a major GC, i.e., a full GC.
VisualVM is a great tool to help visualise GC. The GIF below visualises a GC currently in progress. Let’s understand a number of concepts introduced above with the help of visual aid. The first thing to notices is the spaces section. There are five different spaces i.e. Old Generation, Eden, S0, S1, and Metaspace. The first thing to take cognizance of is that all new objects are allocated into Eden. You will notice the amount of memory occupied by Eden steadily increases. A Minor GC immediately decreases the space occupied by Eden. As most of the objects in Eden are dead, these objects are removed from memory. The objects that are alive are copied into one of the survivor spaces, i.e., S0 or S1. Notice how at any given point in time, one of the survivor spaces is always empty. On every minor GC, the survivor space occupied is switched.
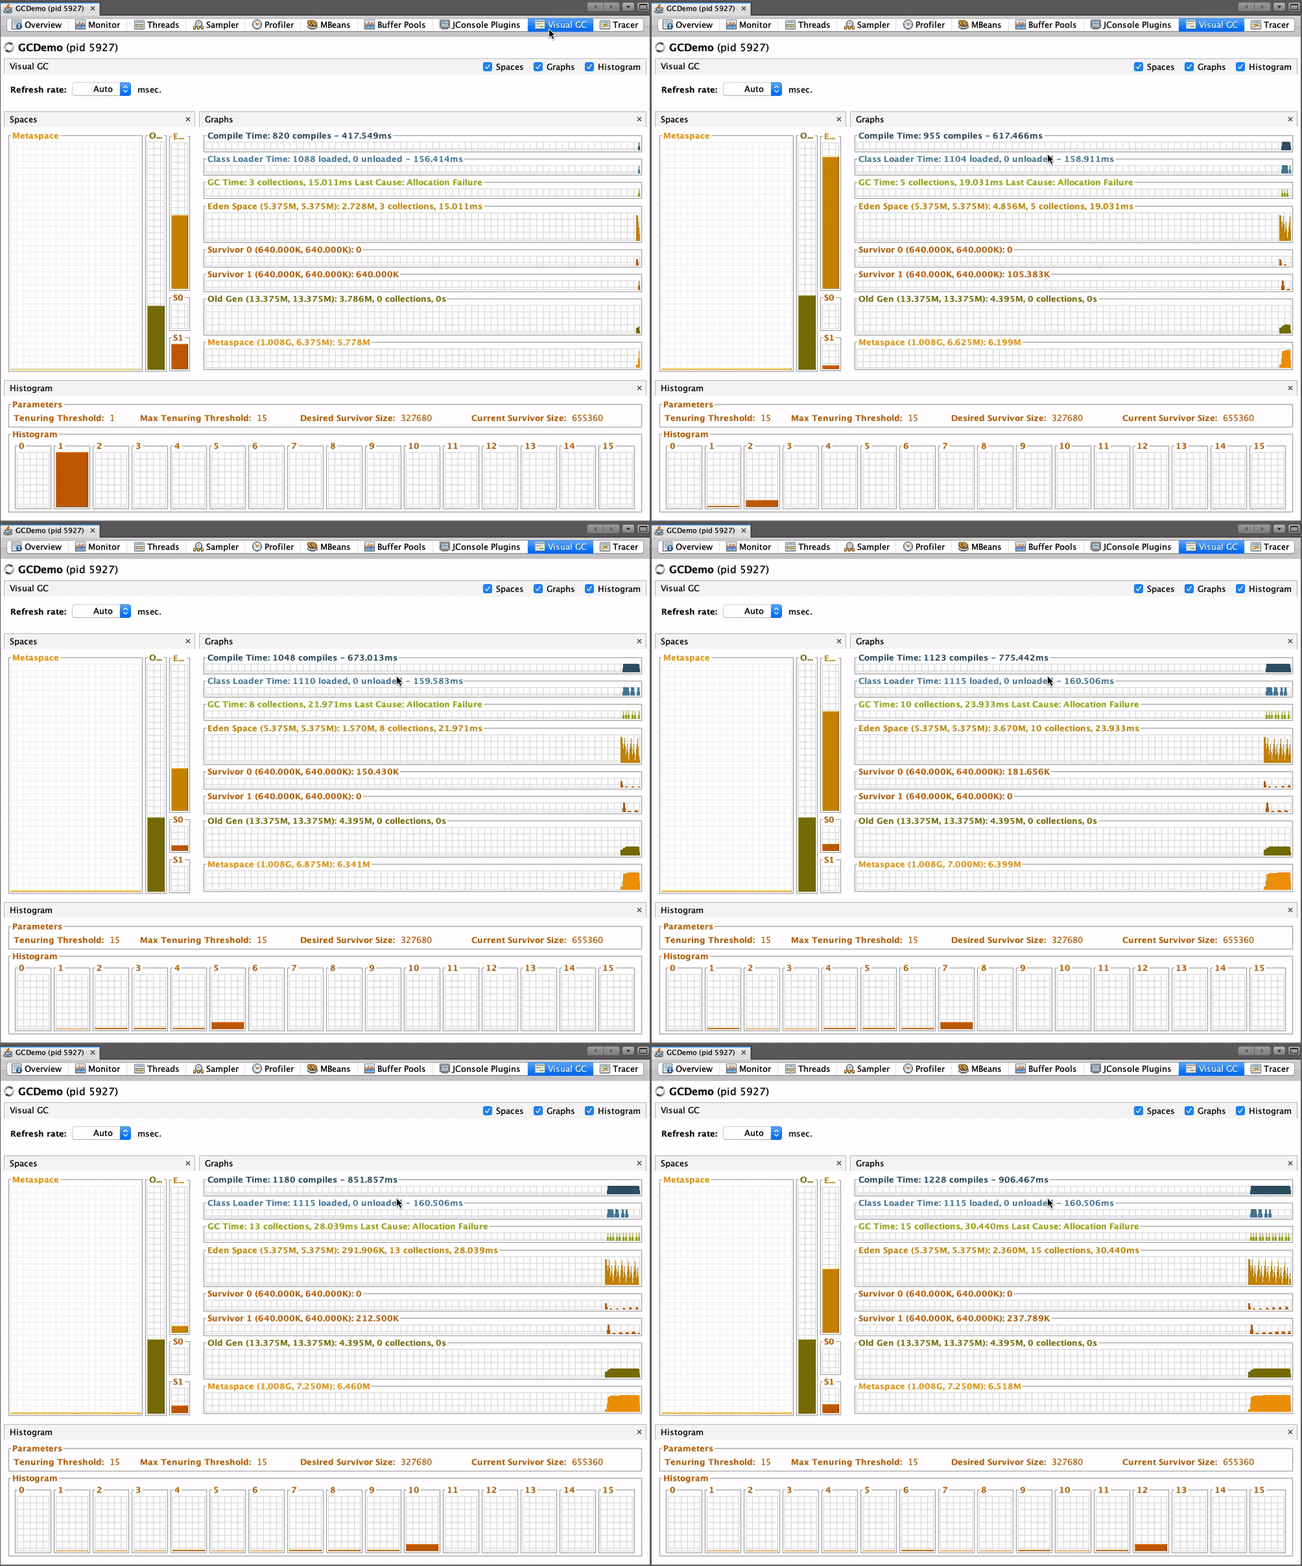
Notice the histogram section located at the bottom of the GIF. The section outlines objects in the young generation by object age. In the image above, the tenuring threshold and the max tenuring threshold that is set to 15. Notice how on every minor GC, the object’s tenuring threshold steadily increases till the object is aged and eventually promoted into the old generation.
Please take note of the “collections heading” in the Eden Space section under the graph section. On every minor GC the number of collections is incremented. This is a good way to gauge the number of minor GC tacking place. The number of Major GC’s can also be easily determined by looking at the “collections heading” in the Old Gen section. Along with the number of collections, these spaces also provide you with the total amount of time spent doing the respective GC.
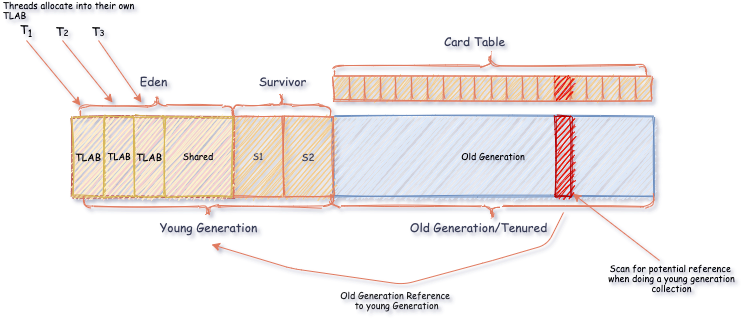
The diagram below helps us visualize the Java Heap. Notice the TLAB’s and the shared memory space in Eden. Also, take note of the card table and how it helps identify portions of the old generation that need to be scanned when doing a young generation collection.
 |
|---|
| Java Heap Layout |
One of the key challenges with the old generation is tracking references from the old generation into the young generation. A divided heap necessitates the need to track higher to lower generation references, i.e. old generation reference into the young generation references. According to the weak generational hypothesis, there will be a few references from the old generation to the younger generations. One approach to track these references would be to trace the entire object graph. Tracing the complete object graph would eliminate many of the advantages provided by the generational GC approach. We thus need to narrow down the object traversal to prevent the GC cycle from having to traverse the entire object graph. Generally, a Write barrier + card-table are used to track potential old-generation to young generation references. Cards tables are populated using a write barrier. Every time an old generation object is mutated, a write barrier is used to update the card table. GC records the old to young generation references with the help of the card table. A card table is a bitmap that spans the entire old generation. When a potential young generation reference is created, the associated bit is flipped. A flipped bit indicates the need for the young generation to be scanned for potential references.
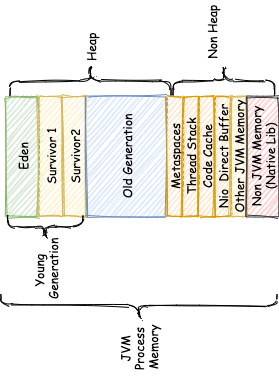
Java has a number of memory allocation spaces of which the heap is one.
 |
|---|
| Java Process Memory |
The diagram above summarizes the space occupied by a Java process. This section will provide a brief summary of non-heap memory allocation categories:
- Permanent Generation/Metaspace – Permanent Generation or PermGen was used to store class metadata up to Java 7. PermGen was a memory area that was laid out contiguously with the heap. The PermGen did not scale dynamically and thus was the root cause of many OutOfMemory exceptions in Java. In Java 8 PermGen was replaced with an area called Metaspaces. Metaspaces reside in native memory as opposed to being contiguously allocated along with the heap. Metaspaces are unbounded by default and thus can grow/shrink as needed.
- Thread Stack – Each Java thread created has its own thread stack, i.e., a separate piece of memory allocated for the thread’s needs. The thread stack contains information about methods called to reach the current execution point and all local variables associated with each of those method calls.
- Code cache – The JIT is continuously looking for optimisations. This is done by optimising frequently executed interpreted code into native code. The native code is stored in an area called code cache. The code cache can be tuned via command-line arguments. Once the code cache is full, the JIT will stop the compiler threads and will no longer optimise interpreted code.
- Buffer pools – This is a chunk of native memory allocated outside the heap. These buffers may use native OS code for I/O and are thus faster. Buffer pools are used by a number of libraries and frameworks to improve performance. Buffer pools are used to share memory between Java code and native code, or map regions of a file into memory.
- OS memory – The OS also has its own heap and stack for the Java process. This is independent of the JVM’s heap and stack. The OS also loads native libraries to drive the java process. The memory consumed by the OS is usually tiny.
No comments yet.